Renewables Contributed >40% of Germany’s Electricity, Fraunhofer ISE Says
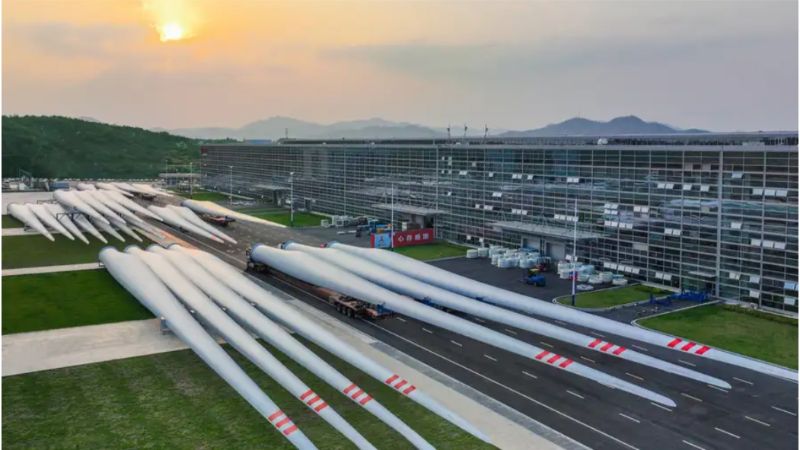
Researchers at the Fraunhofer Institute for Solar Energy Systems ISE released their annual assessment covering the net electricity generated for Germany's public power supply in 2018. Based on the production figures, solar energy recorded the largest growth at 16%, ahead of wind energy with 5.4% growth. At the same time, the assessment revealed that the net electricity from gas, coal, and hydropower decreased.
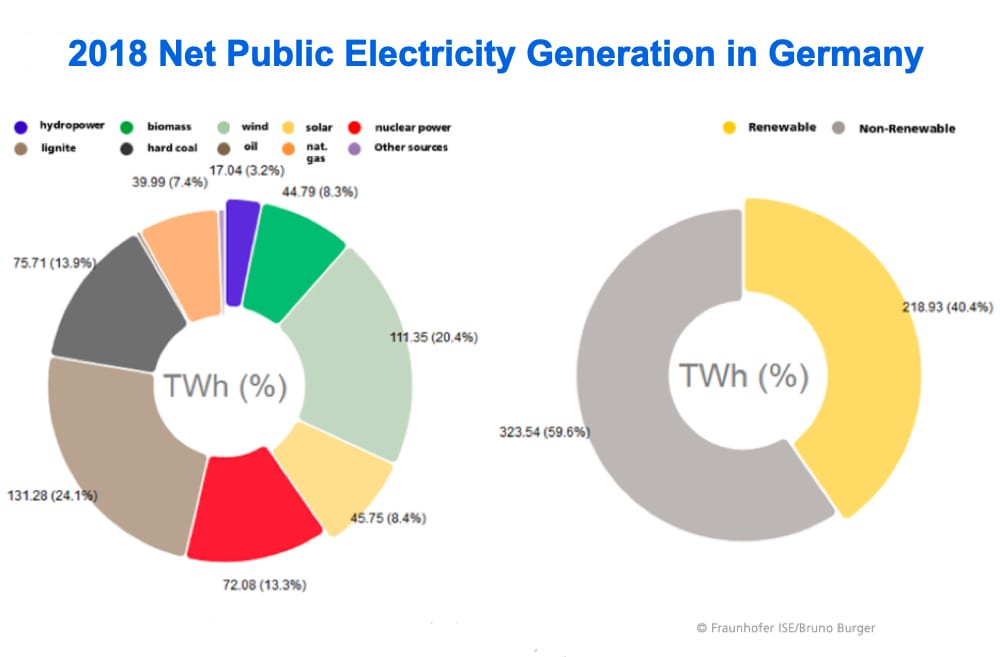
In 2018, renewable sources made up over 40% of the public net electricity generation, which is the electricity mix fed into the public power grid. During 2018, German photovoltaic plants contributed about 45.7TWh into the public electricity grid, 16% more than the previous year. As of the end of November, new photovoltaic installations of 3.2GW increased the installed capacity to 45.5GW. (See the graphs above courtesy of Burger, Fraunhofer ISE from the reference listed below. The chart shows the net electricity generation from power plants for the public power supply in Germany. Generation from power plants within the manufacturing, mining, and quarrying industries, i.e. the self-generation of electricity in industry, is not included.)
On July 2, 2018, at 1:15 p.m., solar power production peaked at about 32GW, corresponding to 39% of the total power production at that point. From April through August of 2018, German photovoltaic plants produced more electricity per month than hard coal power plants.
Electricity from wind was about 111TWh in 2018, making it the second largest source of electricity after brown coal. During ten months out of the year, wind electricity surpassed electricity production from hard coal and nuclear.
Wind power production peaked at about 45.9GW on December 8 at 12:00 noon. In 2018, onshore wind produced 87.4TWh of electricity, an increase of 2 TWh compared to 2017. Offshore wind electricity generation grew from 17.4TWh in 2017 to over 18.8TWh in 2018. The majority of the electricity generated from offshore wind, or 16.6TWh, was produced in the North Sea.
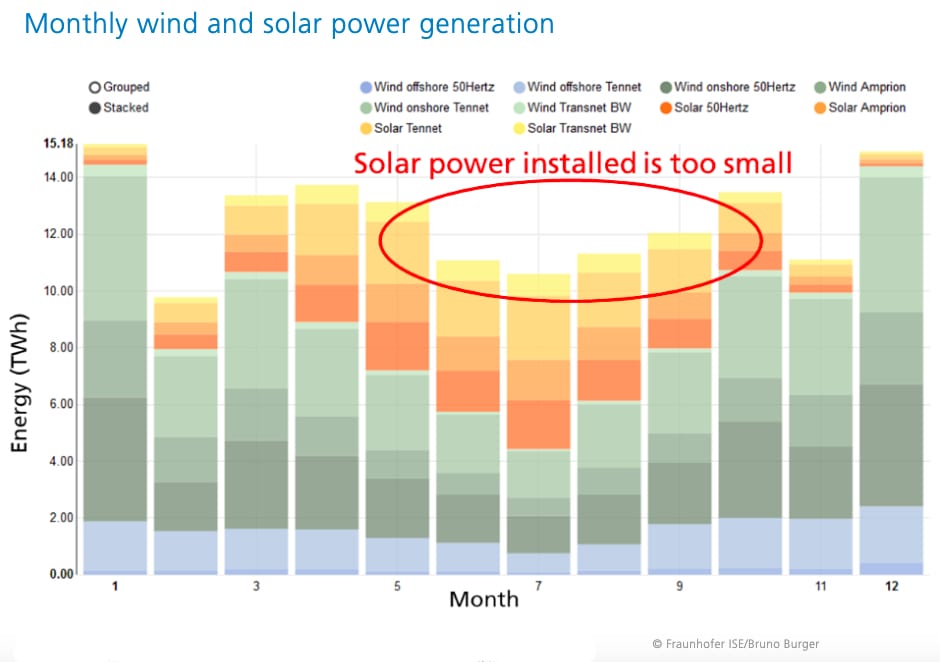 Despite high irradiation values in summer, solar power generation was too small to compensate for the seasonal reduction of the wind generation. For this reason, Fraunhofer ISE says that the installed solar capacity is too small in relation to the installed wind capacity. Graph: B. Burger, Fraunhofer ISE. (click on image to enlarge)
As a result of the very dry summer, hydropower added just 17TWh to the electricity grid, the second lowest amount in 30 years. From May to December, the monthly electricity generated from hydropower was less than the previous year.
At about 44.8TWh, electricity from biomass was equivalent to the production in 2017.
The total electricity production from all renewable sources for 2018 reached about 219TWh, an increase of 4.3% compared to 2017. With this total, renewables contributed over 40% to the public net electricity generation in Germany.
The electricity produced by nuclear plants was 72.1TWh in 2018, approximately equivalent to 2017.
Brown coal power plants generated 131.3TWh net electricity. This amount is about 2.7TWh or 2% less than 2017. Fraunhofer ISE found that the brown coal power plants reacted more flexibly than in the past to the periods of low prices on the electricity exchange, and these plants reduced the power generated to below 6GW, such as on January 5 and December 12 of 2018. The curbing of power generating took place mainly during periods with low or negative electricity prices on the exchange. According to Fraunhofer ISE, brown coal power plants still do not react flexibly to a high feed-in from renewables.
 (click on image to enlarge)
The net electricity production from hard coal power plants was 75.7TWh for 2018, down by 6TWh, or 7.4% compared to 2017 values.
Gas plants showed the greatest decrease in production, contributing 40TWh net electricity, which was 9.1TWh less than the 2017 level for a decrease of 18.5%. Gas plants for the manufacturing and mining industries also produced about 20TWh to 25TWh for self-consumption within the industry.
During 2018, Germany's export surplus (physical flows) was approximately 45.6TWh, slightly lower than 52.5TWh for 2017. The majority of the surplus electricity was exported to Holland (19.2TWh), who then transmitted it on to Belgium and Great Britain. Austria followed in second place with 11.6TWh, ahead of Switzerland with 11.5 TWh) who essentially acted as a transit country for bringing electricity to Italy.
Germany imported 8.3TWh of electricity from France, primarily transmitting it to neighboring countries. The average amount of exported power was about 5.2GW, the equivalent of four nuclear power plants.
For 7730 hours (88 percent) of the year, Germany exported electricity. While during 1030 hours (12 percent of the year), the country imported electricity. From January to October, Germany had an export surplus of 52.8TWh which brought in revenues valued at 1.81 billion euros.
On average, imported electricity cost 42.39 euros/MWh, and exported electricity was 38.60 euros/MWh. The average volume-weighted day-ahead spot price of 43.26 euros/MWh was 30% higher than the 2017 value of 32.89 euros/MWh).
The load was 508.5TWh, an increase of 3.1% compared to 2017.
Data Sources and Information
This first version of the assessment from January 1, 2019, looks at all of the electricity data of the European Electricity Exchange (EEX) in Leipzig through December 31, 2018. The hourly energy generation values from the EEX were corrected utilizing the available monthly data on the electricity generation from the Federal Statistical Office (Destatis) up to and including September 2018, and the monthly data for electricity imports and exports up to and including October 2018. For the remainder of the months, the assessment used data from past years to estimate the correction factors. Hence, these extrapolated values are subject to greater tolerances.
Reference
Burger, B. Net Public Electricity Generation in Germany in 2018, Fraunhofer Institute for Solar Energy Systems ISE: January 4, 2019.